
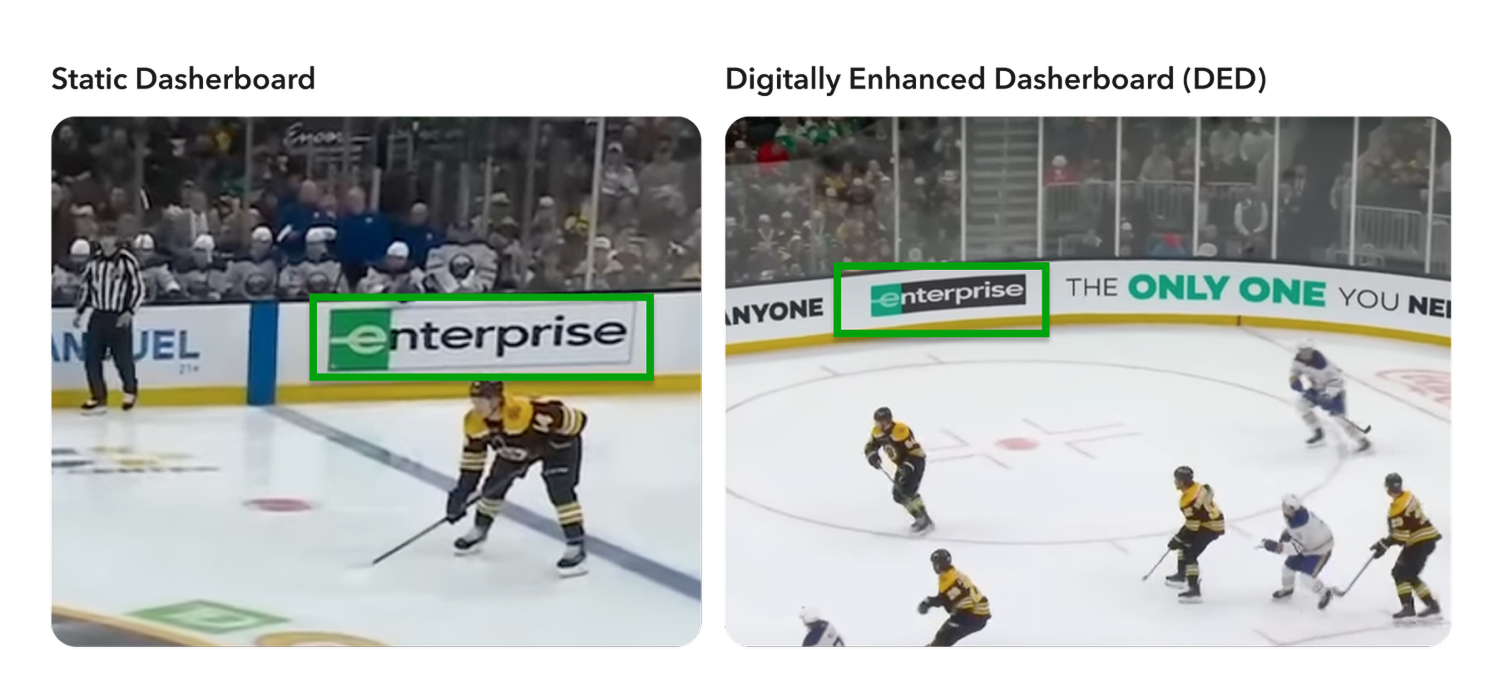
Analyzing display time for dasherboards involves several key metrics that Trajektory tracks second-by-second. The primary challenge is distinguishing between physical (static) signage and digital overlays (DED) during a broadcast.
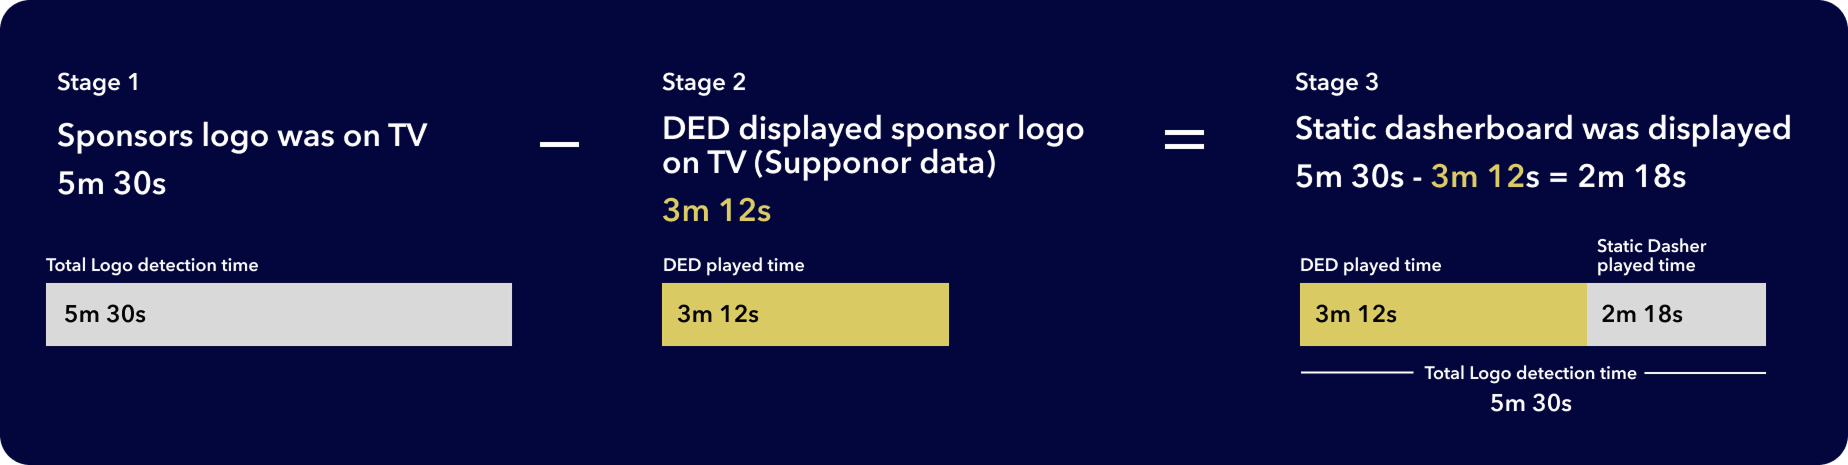
Stage 1 - Logo Location Detection
We utilize an AI-powered logo detection tool (powered by Hive) to analyze and measure the total duration a sponsor’s logo appeared on TV during the game. This covers the entire broadcast view, capturing both physical and digital placements.
Stage 2 - DED Played Time Integration
Next, we obtain the precise display time of the sponsor's Digitally Enhanced Dasherboard (DED) for the specific game. This data is often provided directly by digital ad placement partners like Supponor, ensuring accurate tracking of digital overlays.
Stage 3 - Calculating Static Display Time
The final step is to calculate the static dasherboard's TV display time. We do this by subtracting the recorded DED display time from the total logo detection duration. This result represents the net value and exposure of your physical in-venue assets during the broadcast.
Our dashboards allow you to filter results by game, period, and partner to see how these manual and digital assets compare in terms of total duration and clarity, providing a comprehensive view of your sponsorship visibility.